QuantLib in the last decade
Greetings.
Leave it to me to write an end-of-year post—end-of-decade, even—when we’re already a few weeks into January. Oh, well: it’s still a good time to stop for a while and think of what happened to QuantLib so far.
The short term
2019 was an ok year. We had three releases (1.15 in February, 1.16 in August, and 1.17 in December) and a level of activity which is not bad for a niche project: almost 400 commits, or slightly more than one per day, shared between 25 contributors of which 11 were new.
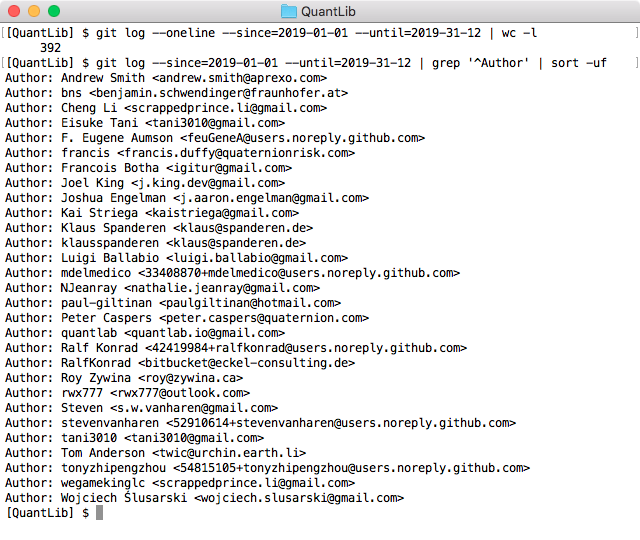
Also, these numbers (which already make me happy as they are) only include commit authors and don’t count all the people that reported bugs, or that fielded questions on the mailing list and Stack Exchange. Thanks, everybody.
Further back
We released QuantLib 1.0 in early 2010, so we might say that the past decade, its second, was the first of its adult life. We had contributions, some of them quite substantial, but the structure of the library didn’t undergo fundamental changes—probably for the better, as more and more people came to depend on it. The total number of contributors during these 10 year has been around 100 (95 according to GitHub, around 110 according to the git logs: a mystery I’ll tackle another time). Again, thanks to every one of you.
On a more personal note, I also published Implementing QuantLib and, together with Goutham Balaraman, QuantLib Python Cookbook. Both had a good response (as I write, about a thousand people bought each book) for which I am grateful.
The future
We’ll see. The good thing of these retrospective posts is that they do make you stop, realize the number of people that are in this together with you, and—what do the young people say?—feel all the feels. It kind of stimulates you to jump into the next decade. In the next post or three, I’ll describe a few possible directions in which we might start working. This year is also the one in which QuantLib turns 20: I’ll get back to this as well.
In the meantime, here’s a pretty video. It’s made with Gource, and it visualizes the development of QuantLib as documented by version control logs since its beginning. The dots are files, the lines connecting them are directories, and committers are little people going around and touching files.
I commented on a similar video in another post about three years ago. Looking at the last three years, I stand by what I wrote then: the video really brings home to me the constant buzz of activity around the code in the last years. So, if you’re one of the contributors: thanks, and have fun trying to see your name in the video. And if you’re not, it’s not too late. You might end up in the next update.
Subscribe to my Substack to receive my posts in your inbox, or follow me on Twitter or LinkedIn if you want to be notified of new posts, or subscribe via RSS if you’re the tech type: the buttons for all that are in the footer. Also, I’m available for training, both online and (when possible) on-site: visit my Training page for more information.